import numpy as np
import random
import matplotlib.pyplot as pltImport libraries
Data
X = [*range(1, 51)]
Y = list(map(lambda x: 2 * x + 5, X))
Univariate Regression
\(h() = X + b\)
MSE cost function
\((h(x) - y)^2\)
Gradient Descent
repeat {

    Ø = Ø - ∆J(Ø) = Ø - LR*1/m * sum((h(Ø, b) - Y)*X)

    b = b - ∆J(b) =  b - LR*1/m * sum((h(Ø, b) - Y))
}
def mse(y_true, y_pred):
    cost = 0
    m = len(y_pred)
    for i in range(m):
        cost += (y_pred[i] - y_true[i]) ** 2
    return cost / (2 * m)


def der_mse(y_true, y_pred):
    der_cost = 0
    m = len(y_pred)
    for i in range(m):
        der_cost += y_pred[i] - y_true[i]
    return der_cost


def predict(x):
    return w * x + b
# Intialization of variables
m = len(X)
LR = 0.01
w, b = 0, 0.1
epochs = 10000
# Training
total_cost = []
for i in range(epochs):
y_pred = []
epoch_cost = []
for num, data in enumerate(zip(X, Y)):
x, y = data
y_pred = []
y_pred.append(w * x + b)
cost = mse(Y[num : num + 1], y_pred)
epoch_cost.append(cost)
der_cost = der_mse(Y[num : num + 1], y_pred)
w -= LR * (1 / m) * der_cost * x
b -= LR * (1 / m) * der_cost
total_cost.append(np.mean(epoch_cost))
if i % 500 == 0:
print(f"epoch:{i}\t\tcost:{cost}")epoch:0 cost:0.024546020195931887
epoch:500 cost:0.0035238913511105277
epoch:1000 cost:0.0004771777468473895
epoch:1500 cost:6.461567040474519e-05
epoch:2000 cost:8.749747634800157e-06
epoch:2500 cost:1.1848222450189964e-06
epoch:3000 cost:1.604393419109384e-07
epoch:3500 cost:2.1725438173628743e-08
epoch:4000 cost:2.9418885555175706e-09
epoch:4500 cost:3.983674896607656e-10
epoch:5000 cost:5.3943803161575866e-11
epoch:5500 cost:7.30464704919418e-12
epoch:6000 cost:9.891380608202818e-13
epoch:6500 cost:1.3394131683086816e-13
epoch:7000 cost:1.8137281109430194e-14
epoch:7500 cost:2.4560089530711338e-15
epoch:8000 cost:3.3257381016463754e-16
epoch:8500 cost:4.5034718706313674e-17
epoch:9000 cost:6.09814092196085e-18
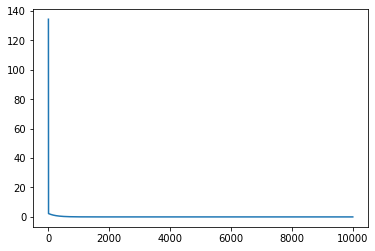
epoch:9500 cost:8.25761584212193e-19predict(2), predict(9)(8.999999990490096, 22.999999991911498)w, b(2.000000000203057, 4.999999990083981)plt.plot(total_cost)
plt.show()